Confirmation of Damage

Lightning strikes can cause a fault on a line, damage equipment and injure operators working on a line. Having a good situational awareness tool when a lightning event is happening in real time, will allow you to see the impact of the event on your assets, giving you an early assessment of the severity of the event.

Indji Watch is the only solution on the market that can not only tell you if there was lightning near your lines or sub-stations, but can also immediately tell you the amperage of the lightning event, distance between where the strike occurred and your asset, and the best areas to inspect for damage. The Lightning Fault Analyst tool makes it easy to quickly correlate if lightning occurred near your sub-station or line at the time a fault was identified, so you can save time directing maintenance crews to a specific location, instead of manually searching for the strike location.

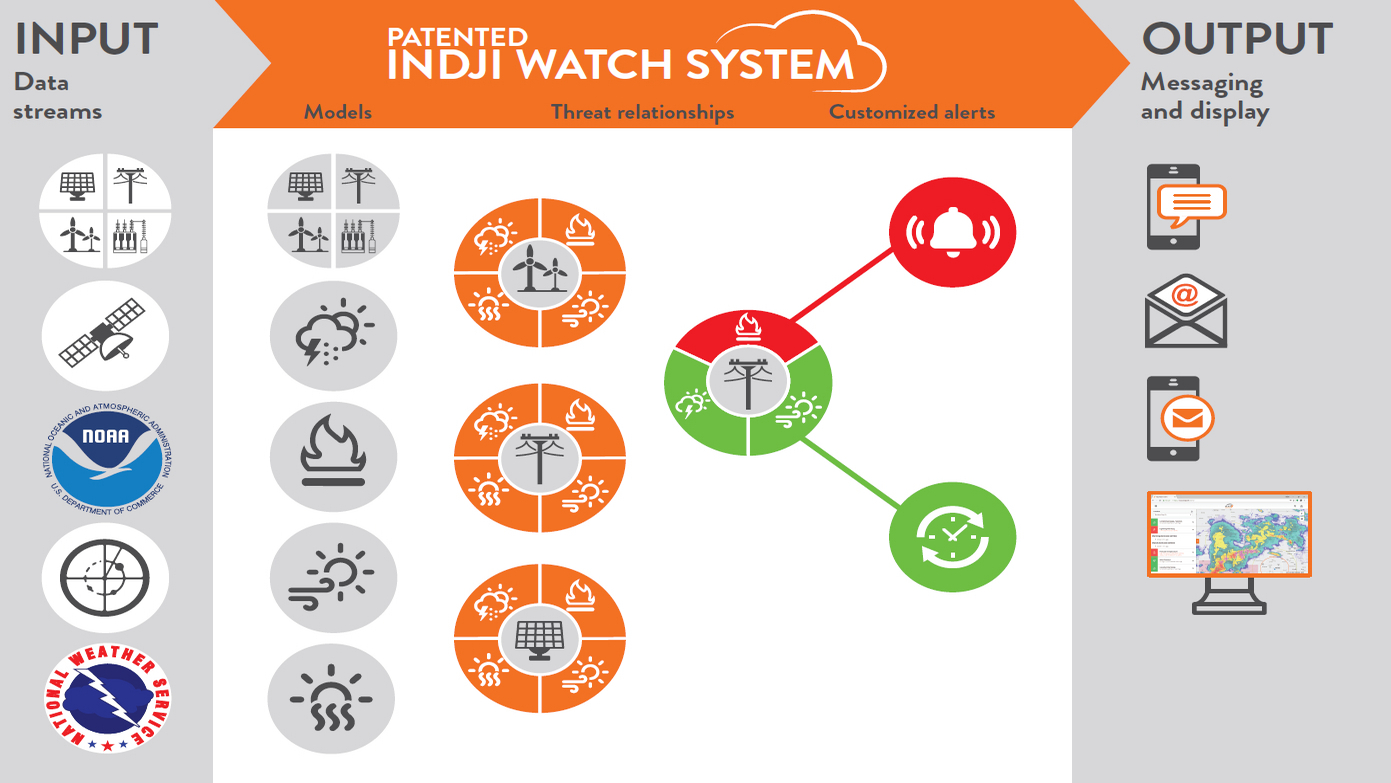
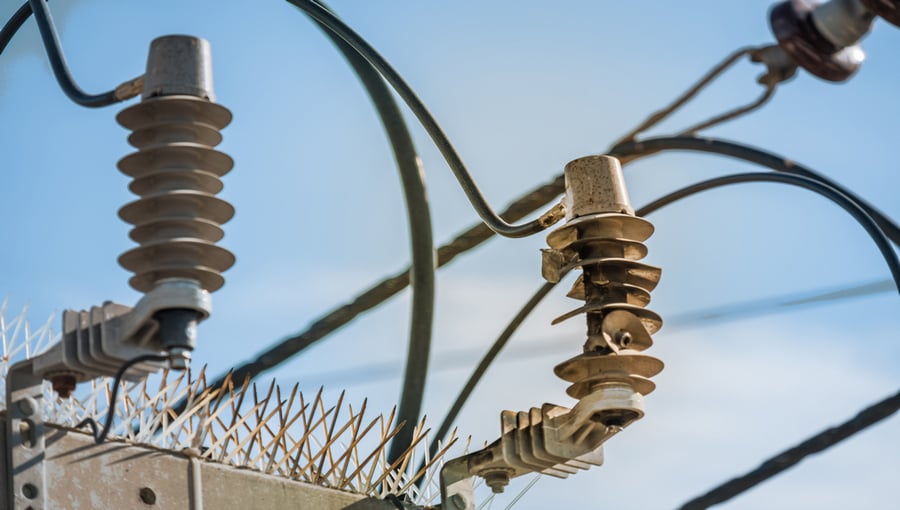
Indji Systems partners with Vaisala, who owns the National Lightning Detection Network, to provide you with the most accurate and up-to-date storm and lightning data. The location accuracy has improved over the years and now plotting of the strikes can be accurate to within 100-150 meters, helping pinpoint fault locations quickly, determine if a line can be safely reclosed, thereby preventing potential equipment damage and more efficiently schedule your outage response teams.

shutterstock_1366235297_small_16-9


Indji Watch makes it easy to detect if lighting struck your line or sub-station. Just five easy steps and you quickly have the information you need to determine if and where a strike occurred, saving you time locating possible damage.

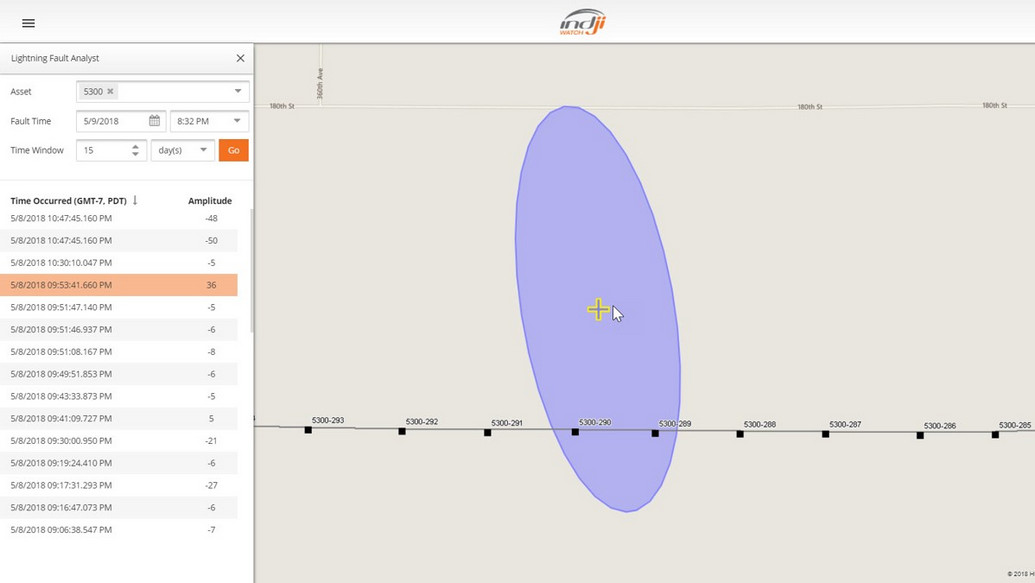
  1. From Indji Watch, open the Lightning Fault Analyst from the upper left navigation menu
  2. Select each Asset you would like to conduct an analysis on—you may choose as many assets from drop down as you need
  3. Enter the Fault Time—enter the exact date and time the fault occurred if you know it, or enter an approximation
  4. Select a Time Window in hours, minutes or days–This will allow you to see lightning data in relation to your asset, that occurred in that Time Window prior to the Fault Time
  5. Select Go


Utiility-light_event


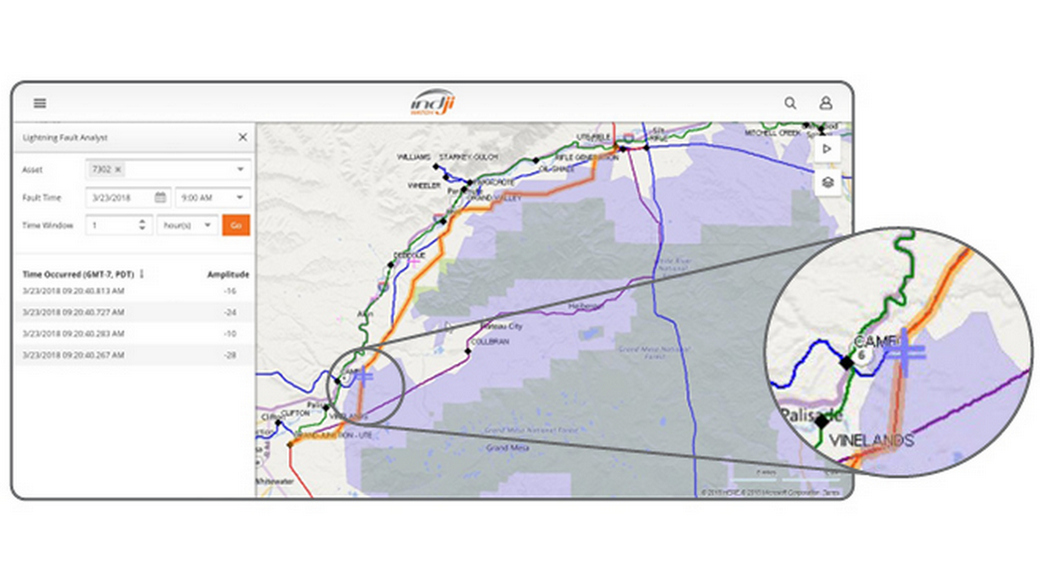
The lightning strikes are displayed as a table under the chosen parameters, giving you the exact time the strike occurred, and the strike amplitude in kA and the polarity of the charge. The lightning strikes are also displayed in blue on the right of your screen in relationship to the assets you have chosen. By default, the table of results is ordered by time. You can change the sort order by clicking on the appropriate column header. To zoom to a strike on the map, just double-click on an entry in the table. To highlight a strike on the map and display the 99% confidence error ellipse, just click once on the strike entry in the table. The measuring tool will let you check the distance between the strike and your asset.

Best utility LFA_HTML with confidence ellipse


Share this article


other resources you may be interested in

Lightning over transmission lines

Forecast Radar/Forecast Lightning

Article

See advanced storms and potential lightning predicted for the upcoming eight hours in relation to your assets with the Indji Watch Forecast Radar and Forecast Lightning tools.

Read more

Lightning over power lines

5 Easy Steps

Article

See how easy it is to tell if lightning struck near your lines or substations, the distance between where the strike occurred and your asset. 

Read more

Lightning storm

Threat Web Service

Article

Access current lightning threat information as raw data via the Indji Watch Threat Web Service. This option lets you incorporate a live feed of active lightning threats into internal systems.

Read more

patent infogrpahic_web

A Patented Difference

Article

To accurately monitor and alert on weather threats that may impact your assets or team safety, you need a patented system that precisely maps your lines, substations and other assets.

Read more